LinkedIn
 Twitter
 Facebook
 Youtube



In a logistics business intelligence project, the dashboard is the easy part. The data underneath it is where the project stalls. A logistics operation already captures what a decision needs: pickup and delivery times, carrier costs, fuel, dock throughput, on-time rates by lane. What a logistics BI dashboard adds is the path from that data to a decision.
A weekly report from your logistics reporting software shows on-time fell to 82% and stops. A dashboard traces it to the lane, carrier, and shipment behind it, and puts the next action one click away.
What a logistics BI dashboard is
A logistics BI dashboard is a single screen that turns live operational data into a decision. It pulls numbers from the systems that run the operation, shows the few that matter for one role, and lets the user act on a problem without leaving the screen.
Five things sit on a working one:
- Live KPIs. The five to eight a role acts on, not every metric the database holds.
- Drill-down. A click from a falling number to the lane, carrier, and shipment behind it.
- Context. Each number against its target, its trend, and the comparable lanes.
- Alerts. A push when something moves out of range, so the team works exceptions, not screens.
- Actions. The next step in the same tool, such as the at-risk alert with a rebooking button or the overcharge flag that opens a dispute.
What information they hold
Whatever the role, the raw material is the same handful of data categories, pulled from the operational systems and joined in one place:
| Data category | Examples |
|---|---|
| Shipment status | active loads, delayed loads, missed milestones |
| Carrier performance | on-time pickup, on-time delivery, tender acceptance |
| Cost data | freight spend, cost per shipment, accessorials |
| Warehouse data | dock throughput, appointment delays, dock-to-stock time |
| Customer / SLA data | SLA compliance, late deliveries by client |
| Invoice / audit data | EDI 210, overcharges, dispute status |
| Fleet / telematics | vehicle location, fuel, utilization, idle time |
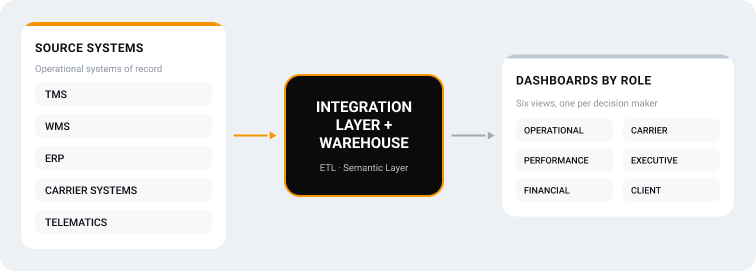
The sources are the TMS, WMS, ERP, carrier systems, and telematics. Each role's dashboard slices these categories differently, which is what the blueprint below maps.
Logistics raises the stakes. The data sits in more systems, and the decisions are time-sensitive. A late "in transit" no one sees becomes a missed delivery; an unaudited freight invoice becomes an overpayment. McKinsey puts the prize at 3 to 8 percent of supply chain costs for analytics built on high-quality data, and that saving comes from acting on the data, not owning it.
Why you need dashboards when you already run a TMS, WMS, and ERP
Each operational system reports its own data, on its own screen, tuned for running transactions rather than analysis. The TMS shows today's shipments but not the freight cost reconciled against the ERP. The WMS shows dock throughput but not how a slow dock pushed three loads past their delivery appointment. The ERP shows freight spend but not which lane or carrier drove the climb. None of them answers a question that crosses two systems, and the decisions that matter almost always cross two systems.
| System | What its own screen shows | What it can't answer alone |
|---|---|---|
| TMS | shipments, rates, dispatch, tracking | is this lane's freight cost eating its margin in the ERP? |
| WMS | inventory, dock throughput, dock-to-stock | did slow dock turn cause today's late deliveries? |
| ERP | freight spend, invoices, financials | which carrier and lane drove the spend, by service level? |
| Carrier portals | one carrier's tracking and invoices | how do all carriers compare on the same lane? |
Three gaps survive even when every system has its own reporting tab:
- No cross-system join. The single fact a decision needs, freight cost per on-time delivery by lane, lives half in the TMS and half in the ERP, and neither can compute it.
- No history for trends. Operational systems overwrite or archive. They show now, not the twelve-month trend a sourcing review needs.
- No action layer per role. A dispatcher and a CFO need different five-metric views and different next actions, which no single system's generic report gives.
A logistics BI dashboard exists for the questions that fall between the systems, not the ones each already answers on its own.
Start with the decision, not the dashboard
Build a dashboard from the data up, with every field the TMS exposes on one screen, and you get supply chain analytics nobody reads. A useful dashboard starts from a decision and works back to the few numbers it needs. A logistics KPI dashboard with thirty metrics is noise; the right one shows five to eight, each tied to a call someone makes.
Six logistics dashboards cover the common roles, one each. The blueprint below maps each role to its dashboard, the decision it drives, the metrics, the data sources, the freshness, and the action it triggers.
| Dashboard | User | Decision | Metrics | Data sources | Freshness | Actions |
|---|---|---|---|---|---|---|
| Operational | Dispatcher | Manage today's exceptions | at-risk shipments, late pickups, missed milestones, carrier delays, ETA accuracy | TMS live status, carrier APIs, telematics | Near-real-time | rebook, escalate, notify customer |
| Performance | Operations manager | Catch slipping carriers and lanes | OTIF, on-time rates, transit vs plan, appointment adherence, carrier comparison, throughput, exception frequency | TMS history, WMS | Daily to weekly | reallocate volume before an SLA breach |
| Financial | Finance | Control cost, catch overbilling | freight spend by lane/carrier/client, cost per shipment, budget vs actual, audit savings, margin | TMS rates, EDI 210 invoices, ERP | Daily to monthly | flag an overbilled 210 for dispute |
| Carrier | Procurement | Allocate volume, negotiate rates | on-time, tender acceptance, claims and damage, cost competitiveness by lane | TMS tender and status, claims, rates | Weekly to monthly | shift volume, negotiate with numbers |
| Executive | C-level | Steer strategy, no detail | overall on-time, freight spend trend, CSAT proxy, cost trend, growth | warehouse rollup of the other five | Weekly to monthly | sourcing review on a sustained cost climb |
| Client | 3PL customer | Self-serve transparency | shipment status, SLA compliance, cost breakdown (per client) | operational data, filtered per client | Near-real-time | customer tracks own status and SLA |
Three things the table cannot carry:
- Dispatcher: stale data is worse than none here, because acting on a load that already moved is its own error.
- Finance: this is where freight analytics lives, and joining TMS rates to ERP costs is the join most single-system dashboards skip. Recovered overcharges commonly reach 1 to 5 percent of audited freight spend (FreightAmigo).
- Client: the customer-facing view a 3PL serves inside its 3PL freight management software. Row-level security is enforced at the data layer, not by hiding rows in the UI, so one client never sees another's shipments.
The freshness column sets each dashboard's cost. Push a monthly financial view onto a real-time stream and you pay for streaming infrastructure nobody reads twice a day. Run the operational view on a nightly batch and the dispatcher acts on positions that are hours old. That choice is made before a single chart is drawn.
Take the operational row in a shift. A carrier misses a pickup window, and the dispatcher dashboard flags the load. One click opens the lane, the carrier's on-time history, and the customer's SLA. The dispatcher rebooks to a backup carrier and sends the delay notice from the same screen, before the customer calls. The same event on a weekly PDF surfaces days later, too late to act on.
Beyond the six roles, an emissions dashboard is the common seventh. The view tracks CO₂ per shipment, lane, and mode, plus empty miles and modal split, from the same TMS and telematics data. Shippers reporting under the EU's CSRD (Corporate Sustainability Reporting Directive), or answering customer scope-3 requests for supply-chain emissions, need those numbers at shipment level, and the foundation feeding the other six already holds most of the inputs.
Core logistics KPIs and how to define them
A KPI is useful only once everyone computes it the same way. Each metric below carries one definition, what it counts, and the decision it feeds. OTIF, ETA accuracy, and appointment adherence sit here too, the three a single-system report usually cannot produce.
| KPI | What it counts | Decision it feeds |
|---|---|---|
| On-time delivery (OTD) | Loads delivered by the committed date, measured against the appointment; a partial delivery counts as a miss | which lanes and carriers are slipping |
| OTIF (On Time In Full) | Loads delivered on time and complete, with the right quantity and no damage; stricter than OTD | the service quality the customer actually sees |
| ETA accuracy | Predicted arrival against actual, as average variance in hours | how far to trust tracking and the promises made to customers |
| Appointment adherence | Arrivals inside the booked dock window, over total appointments | dock scheduling and detention cost |
| Freight cost per shipment | Total freight spend divided by shipment count, sliced by lane or mode | budget control and mode shifts |
| Tender acceptance rate | Tenders a carrier accepts over tenders offered | carrier reliability and routing-guide depth |
| Freight audit savings | Recovered overcharges over audited freight spend | recovered cash and billing accuracy |
| Capacity utilization | Used capacity over available, for trucks and dock slots | empty miles and asset ROI |
"On-time delivery" is where this goes wrong most often. The phrase has at least five readings, and a dashboard that pins none of them hands finance and operations different scores for the same week:
- delivered before the planned date
- delivered inside the booked appointment window
- delivered before the latest revised ETA
- delivered only when the full quantity arrived, which is OTIF
- counted on the first delivery attempt, or on the final one
Pick one, write it into the semantic layer, and give it an owner. Which reading you choose matters less than choosing once. A workable default counts on-time as delivered inside the appointment window, full quantity, on the first attempt, with partials as misses. Then the 96% on a slide means the same thing to the warehouse and the CFO.
The data foundation under every dashboard
Every dashboard above is only as honest as the data beneath it, and in logistics that data starts scattered. This is the part generic BI content skips, and where most supply chain business intelligence projects succeed or fail. The McKinsey 2022 Supply Chain Pulse Survey found 67% of companies had stood up dashboards for end-to-end visibility (McKinsey), while far fewer had the integrated data to make them correct.
- Integration first. The TMS holds shipments and rates, the WMS inventory and throughput, the ERP costs, carrier systems tracking and invoices, and fleet management software and telematics the vehicle data. A dashboard wired to the TMS alone shows operations with no financial context. Joining the sources through an API integration layer is the foundation, not a finishing step.
- Clean before you chart. The systems disagree on basics: weight in pounds versus kilograms, different IDs for the same carrier, inconsistent lane names. Analysts spend an estimated 50 to 80 percent of their time finding, cleaning, and organizing data before any analysis starts (Pragmatic Institute). Skip this and the dashboard renders clean charts from dirty data, which is worse than no dashboard because people trust it.
- A place to do analytics. Operational databases are tuned for transactions, not analytical queries. Cross-system analytics and historical trends need a separate store (Azure Synapse, Snowflake, or BigQuery) fed by ETL pipelines. Join freight cost from the TMS with financials from the ERP and the warehouse stops being optional.
- One definition per metric. A semantic layer defines each KPI once, in code, with a named owner. A dashboard and a finance report then cannot show two on-time numbers that never reconcile. On-time delivery alone has several possible readings, so the semantic layer fixes the one the business uses. Each metric carries a defined grain, so a multi-stop load is not quietly counted twice.
Before the first chart, the data should pass a short readiness check:
- Every source reachable by API or scheduled export, not a CSV someone emails each Monday.
- One canonical ID per carrier, lane, and customer across all systems.
- Units reconciled, kilograms against pounds, one currency, one set of time zones.
- A defined grain per metric, so a multi-stop load is counted once.
- A named owner for every KPI definition.
- Enough history loaded for trends, not only the live snapshot.
- Refresh cadence matched to each dashboard's freshness column.
Miss these and the dashboard still renders. It just renders the wrong numbers convincingly.
This layer is data engineering, not chart styling. Skip it and the dashboard looks right until two people compare numbers in a meeting; build it and the numbers hold up under an audit.
Off-the-shelf BI vs custom logistics dashboards
Off-the-shelf BI (Power BI, Tableau, Looker) handles standard analytics on data that can sit in a warehouse. Custom earns its cost when the dashboard has to live inside the operation.
| Reach for off-the-shelf when | Build custom when |
|---|---|
| You need reporting and trend analysis | You need real-time operational views inside the TMS or platform, often part of a custom TMS build |
| Data can be ETL'd into a warehouse | An insight must trigger an action in the same system (alert to rebooking, flag to dispute) |
| You have analysts to build and maintain dashboards | You serve embedded, white-label dashboards to your own clients |
| No real-time tie to the workflow is needed | Logistics-specific logic or data volume breaks standard tools |
Management and financial analytics usually land off-the-shelf. Many operations run both, with custom embedded views for the real-time operational layer inside a supply chain visibility and control tower and off-the-shelf BI for management reporting.
Who usually builds logistics BI dashboards
Four kinds of teams build these dashboards, and the right one depends on how deep the dashboard sits in the operation. An internal BI or data team fits when the company already has analysts and the need is reporting on warehoused data. The logistics platform vendor, a TMS or WMS supplier, ships built-in dashboards that turn on fast but stay limited to that system's data. A BI consultancy builds on Power BI or Tableau, strong on visualization and lighter on logistics data plumbing. A custom logistics software partner builds the integration layer, the warehouse, and embedded operational dashboards as one stack. The single-stack build fits when insights must trigger actions inside the platform or feed white-label client views.
Most operations mix them. An internal team runs off-the-shelf BI for management reporting, while a custom partner builds the real-time operational and client-facing layer that off-the-shelf tools handle awkwardly.
Common dashboard vendor categories
The build-vs-buy choice maps onto five vendor categories.
| Category | Examples | Best for |
|---|---|---|
| Generic BI platforms | Power BI, Tableau, Looker, Qlik | reporting and trend analysis on warehoused data |
| Embedded analytics | Sisense, GoodData | white-label dashboards inside your own product |
| TMS/WMS built-in BI | the vendor's native modules | single-system operational reporting, fast to enable |
| Visibility / control-tower platforms | project44, FourKites | real-time multi-carrier tracking and ETA |
| Custom development | a logistics software partner | integrated, action-embedded, client-facing dashboards |
Common mistakes
The same failures show up across logistics BI projects:
- Starting with charts before data integration. The dashboard renders; the numbers underneath are wrong.
- Showing too many KPIs. Thirty metrics on a screen is noise. A role acts on five to eight.
- Real-time where batch is enough. Streaming infrastructure built for a number nobody reads twice a day.
- No single definition of on-time delivery. Two reports, two numbers, one unwinnable meeting.
- No row-level security on client dashboards. One 3PL customer sees another's shipments.
- BI separated from the workflow. Every insight needs a manual hop before it becomes an action.
- No owner for KPI definitions. A metric gets quietly redefined in a side report and nobody notices.
A practical logistics BI roadmap
The order of the build decides whether it ships. The common failure inverts it, buying a tool and building dashboards first, then finding the data underneath was never integrated. The sequence below puts the foundation before the charts, so each stage earns the budget for the next.
- Audit your data sources. List what each system holds and the state it is in: TMS shipments and rates, WMS inventory and throughput, ERP costs, carrier tracking and invoices, telematics fleet data. Note where each lives, how clean it is, and how reachable through an API. The starting distance is usually further than expected.
- Define the decisions each role makes. Write down what a dispatcher, an operations manager, a CFO, and a procurement lead each decide in a week. Dashboards follow decisions, not the reverse. A metric no role acts on does not belong on the roadmap.
- Agree the KPI definitions. Settle what "on-time delivery" means, and who owns that definition, in one semantic layer before anyone builds a chart. Cheaper on paper than in a leadership meeting with two clashing numbers.
- Build the data integration layer. Connect and normalize the sources from step 1 into a warehouse. This is the largest block of the project and the one generic BI plans skip. Nothing above it is trustworthy until it works.
- Create the first operational dashboard. Ship one high-value view, usually the dispatcher's real-time exception list. A single working dashboard proves the foundation and earns the budget for the rest.
- Add alerts and workflow actions. Turn that dashboard from a screen the team watches into one that pushes an at-risk delivery or a freight overcharge and lets the user act in place. This is where BI starts saving time instead of displaying it.
- Expand to the other roles. Add the financial, carrier, executive, and client dashboards on the foundation already built, each reusing the same KPI definitions. Expansion runs fast once the data and semantic layers exist.
- Add predictive and prescriptive analytics. Once clean historical data has accumulated, layer on forecasting (ETA prediction, demand, at-risk shipment scoring) and recommended actions. This only works on the foundation from steps 4 through 7, which is why it comes last.
A team can stop after any step and still have something useful running.
The minimum viable dashboard
On a small budget, the first dashboard is the dispatcher's exception view, and it needs eight things, not thirty:
- active shipments and their current status
- at-risk shipments, flagged before they breach
- late pickups and late deliveries
- on-time delivery by carrier and lane
- freight cost by lane and carrier
- a single exception list to work down
- drill-down from any line to the shipment behind it
- an owner and an action status on each alert, so every exception is assigned and tracked to closure
Build only these, on integrated data, and the operation has working BI in weeks. Everything else on the roadmap extends this core rather than replacing it.
How TwinCore builds logistics BI solutions
TwinCore builds logistics analytics and BI on the data foundation first, because a dashboard is worth only as much as the clean, joined data beneath it. The team has built logistics software since 2011, with 30+ specialists and 100+ delivered projects, and treats the integration and warehouse work as the project, not the prelude to it.
The work covers the full stack of a logistics BI build:
- a data integration layer joining TMS, WMS, ERP, carrier, and telematics data
- a data warehouse with ETL pipelines for analytics
- custom operational dashboards embedded in logistics platforms, with real-time views and alerts
- embedded white-label dashboards for 3PLs to serve their own clients
- carrier scorecards, freight cost analytics, and KPI dashboards
The relevant work sits across logistics analytics and BI solutions and custom WMS development. The build runs on a .NET and React stack with Azure Synapse and Power BI embedded. What a logistics software team adds to logistics data analytics is domain knowledge of which metrics lead to a decision and how to structure logistics data for supply chain data visualization, beyond rendering a chart.
Conclusion
A logistics BI dashboard pays off when it starts from a decision, shows the few metrics that change an action, and sits on clean, joined data with freshness matched to the use case. A polished dashboard on fragmented, stale data is reporting in new packaging, and it misleads the team that trusts it.
The biggest return comes when the insight and the action live on the same screen, so the at-risk alert and the rebooking happen together. Teams moving off spreadsheets can start with the foundation. See the fleet manager's guide to going digital and TwinCore's wider logistics software work.
Want logistics dashboards that actually drive decisions? Talk to TwinCore.