
 LinkedIn
 Twitter
 Facebook
 Youtube

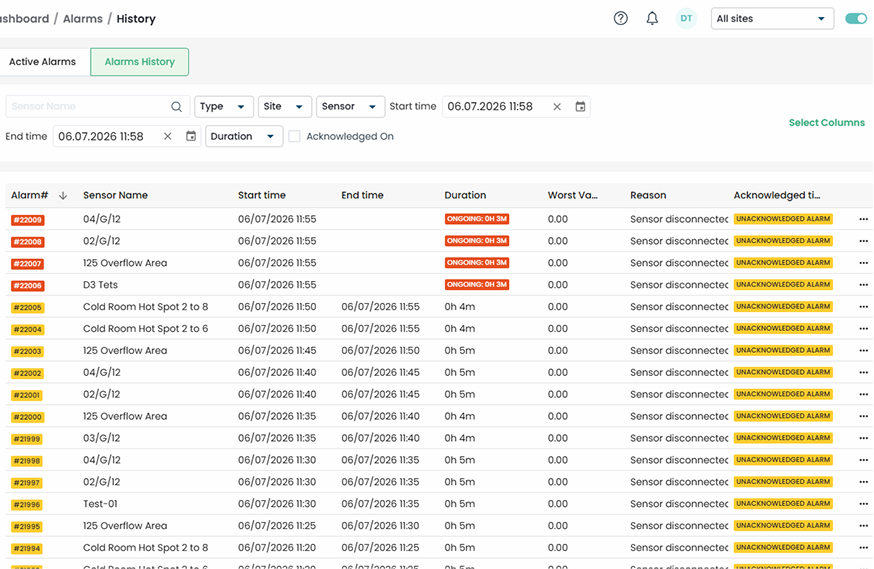
TwinCore built the temperature monitoring platform behind isatec's Sensilla product. Wireless IoT sensors installed across all client sites now stream temperature and humidity data to a single live dashboard around the clock. A breach triggers an alarm after a configurable delay. Every sensor reading is retained in the monitoring history. User actions and alarm responses are recorded in a separate audit log built to support Good Distribution Practice (GDP) inspection workflows.
- .NET backend
- React frontend
- UI/UX designer
- QA
About the client
isatec is a UK company that operates a temperature-monitoring service for cold-chain and regulated-storage customers, including third-party logistics warehouses, medical and pharma distributors, and food operators.
The company supplies and installs wireless sensors at customer sites and is contractually responsible for the resulting sensor data.
“Inside isatec, operators moved day-to-day monitoring onto the platform, and customer users now log in to watch their own sites, acknowledge alarms, and download inspection reports directly.”
Project Goal
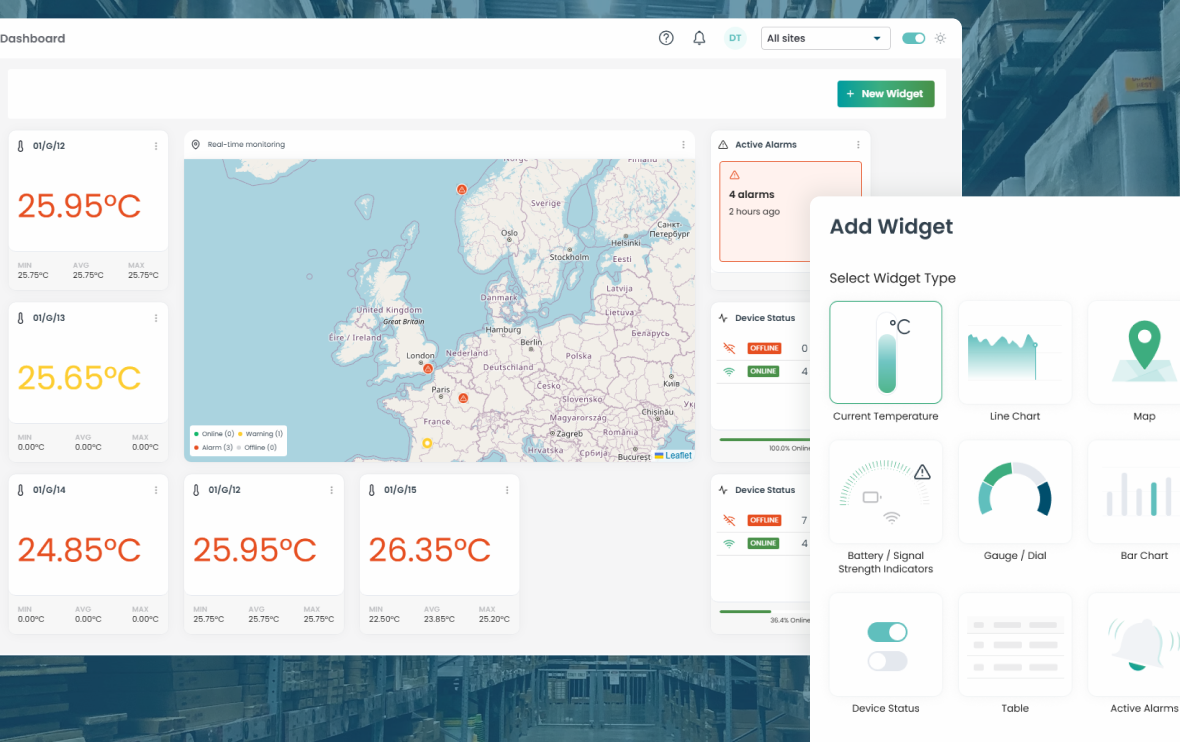
isatec wanted to sell continuous monitoring as a managed service, on top of supplying and installing the sensors. They needed one console where internal operators and customer users could monitor sensors in real time. The same console had to raise alerts when readings move outside safe limits and generate inspection-ready reports for every customer and site.
Experts says

“The key challenge was keeping real-time monitoring reliable despite delayed sensor data, connection gaps, and false alarms. We also had to preserve a complete audit trail without slowing down the live dashboard.”
Solution
The architecture separates operational data from high-volume sensor readings and sends live updates to the browser without constant polling.
- Ingestion and alarm engine — accepts readings from wireless temperature/humidity sensors, evaluates each against its per-sensor limits, and triggers an alarm when a reading remains outside the permitted range beyond the configured delay.
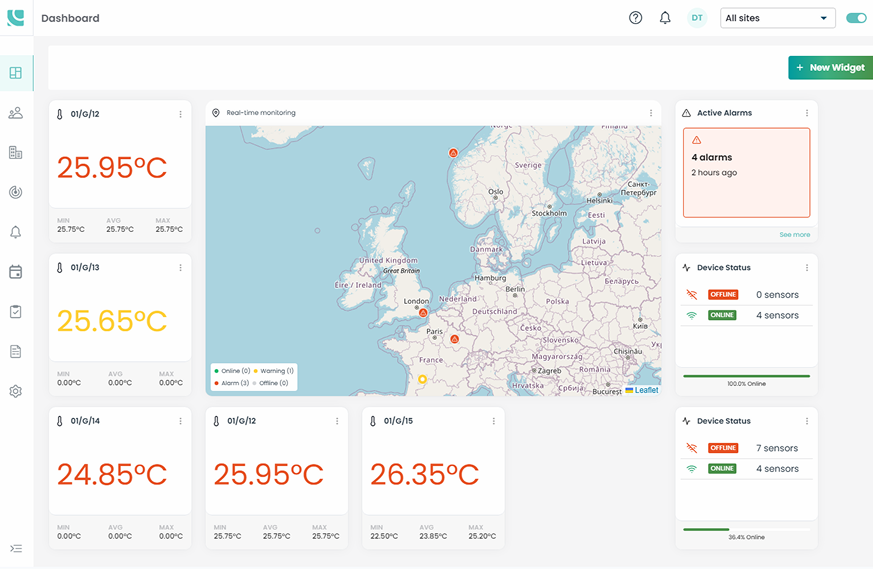
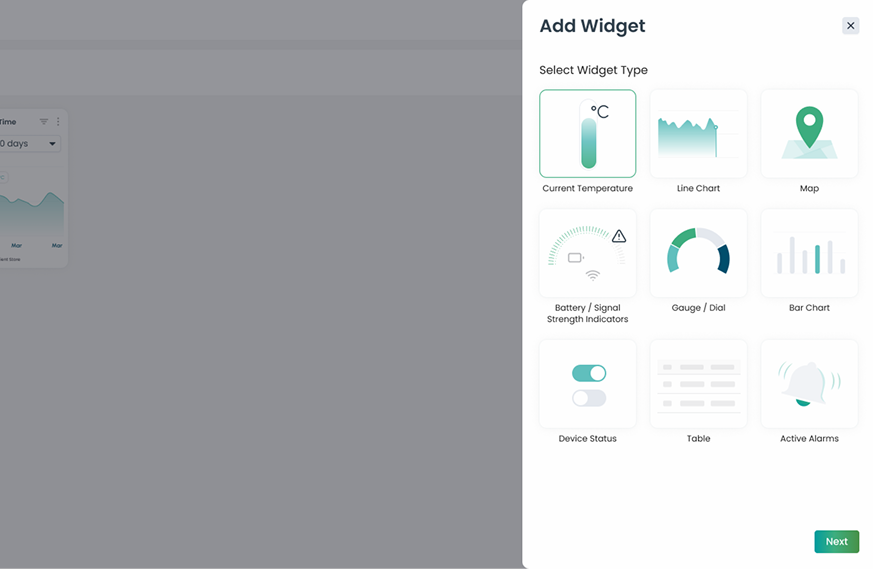
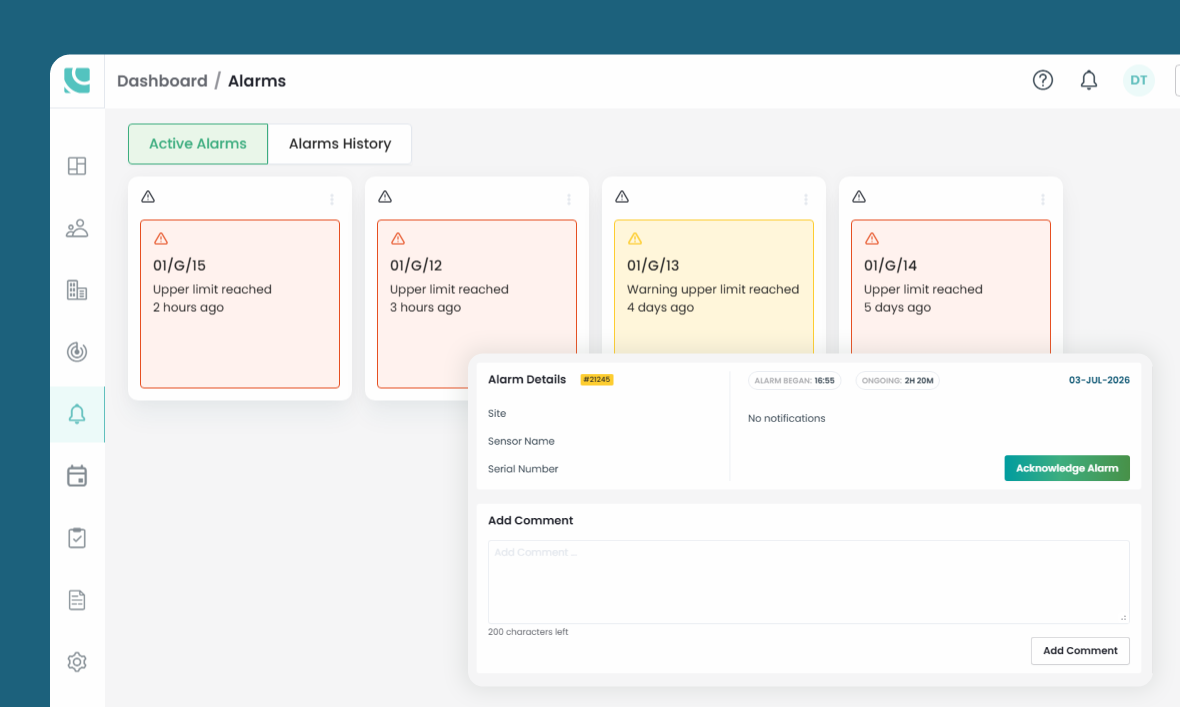
- Real-time layer — SignalR (a .NET library that pushes server updates to browsers over WebSockets) drives live widget updates, the sensor map, and alarm cards without page refreshes.
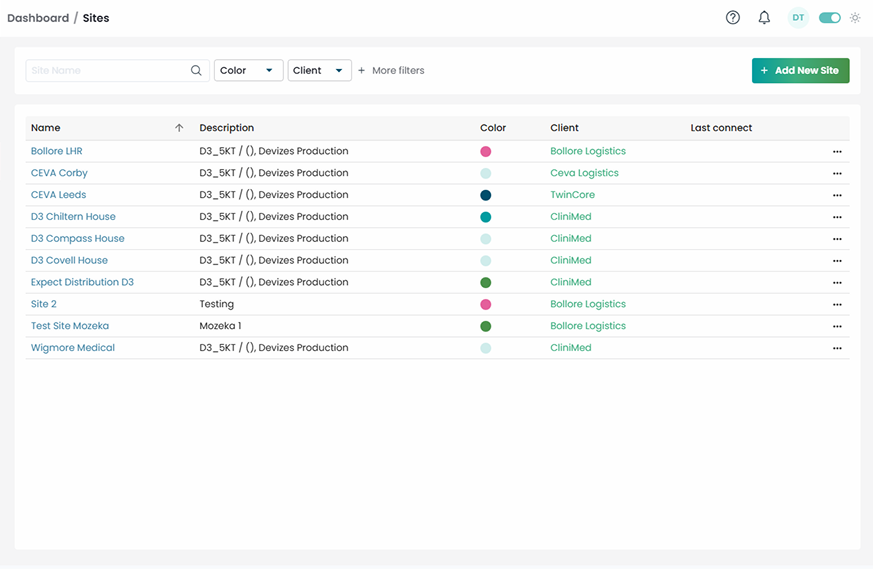
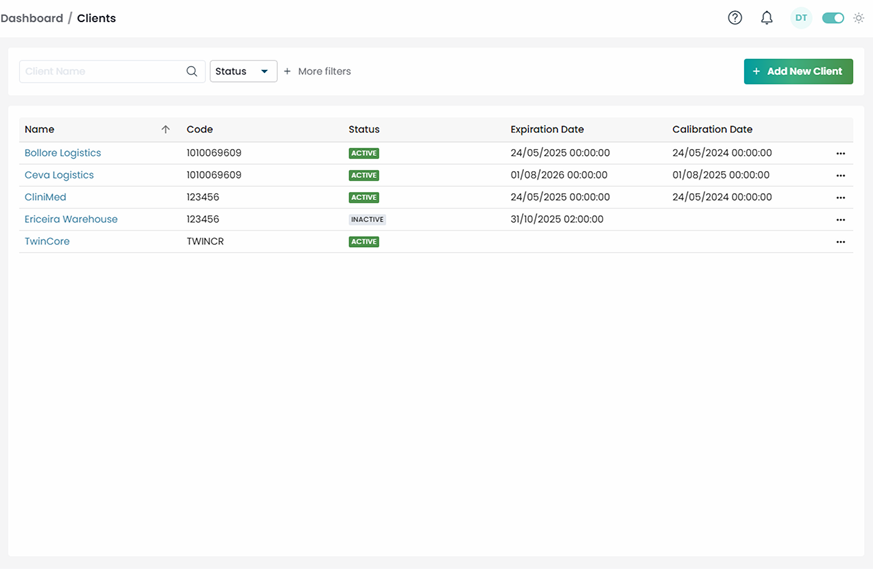
- Multi-tenant model — a Clients → Sites → Sensors hierarchy scopes every query by tenant, reducing the risk of cross-client data exposure.
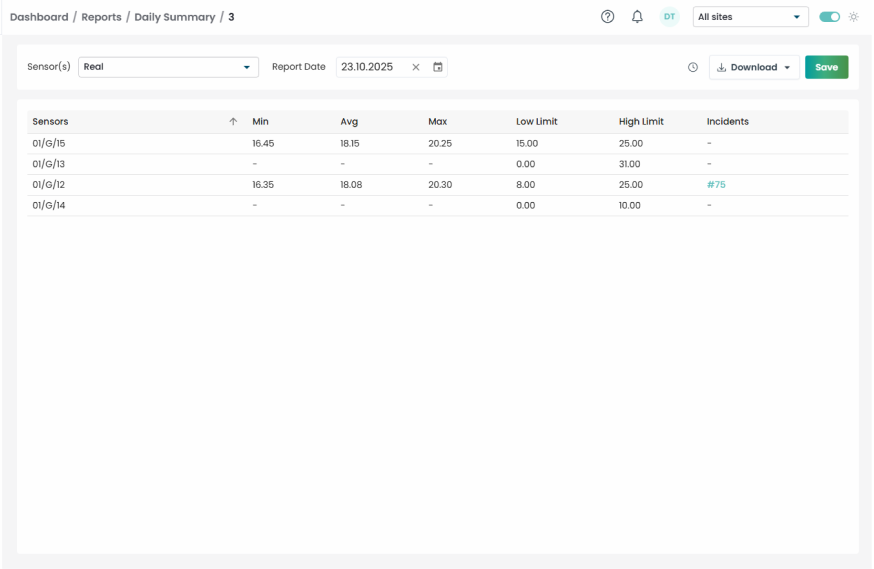
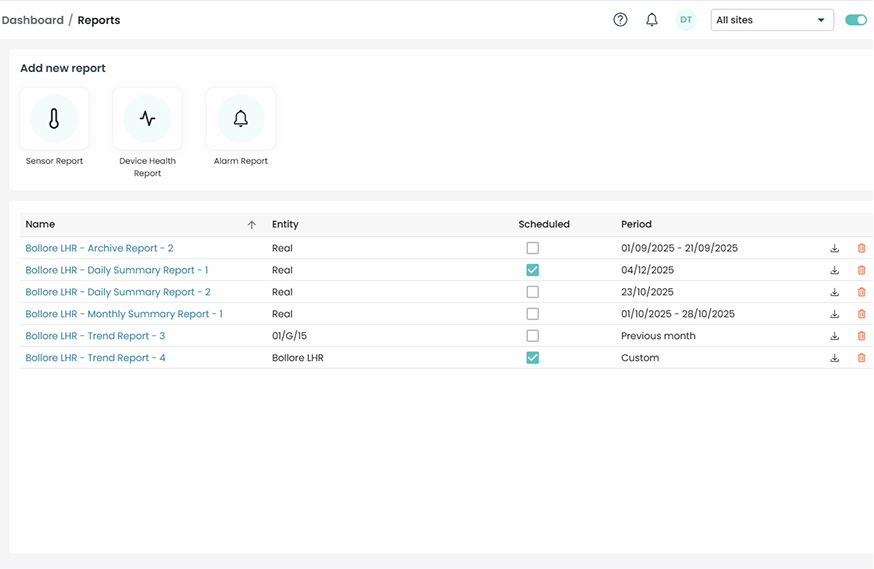
- Reporting module — daily summary, monthly summary, trend, and archive reports, each schedulable and exportable, with min/avg/max and incident counts per sensor.
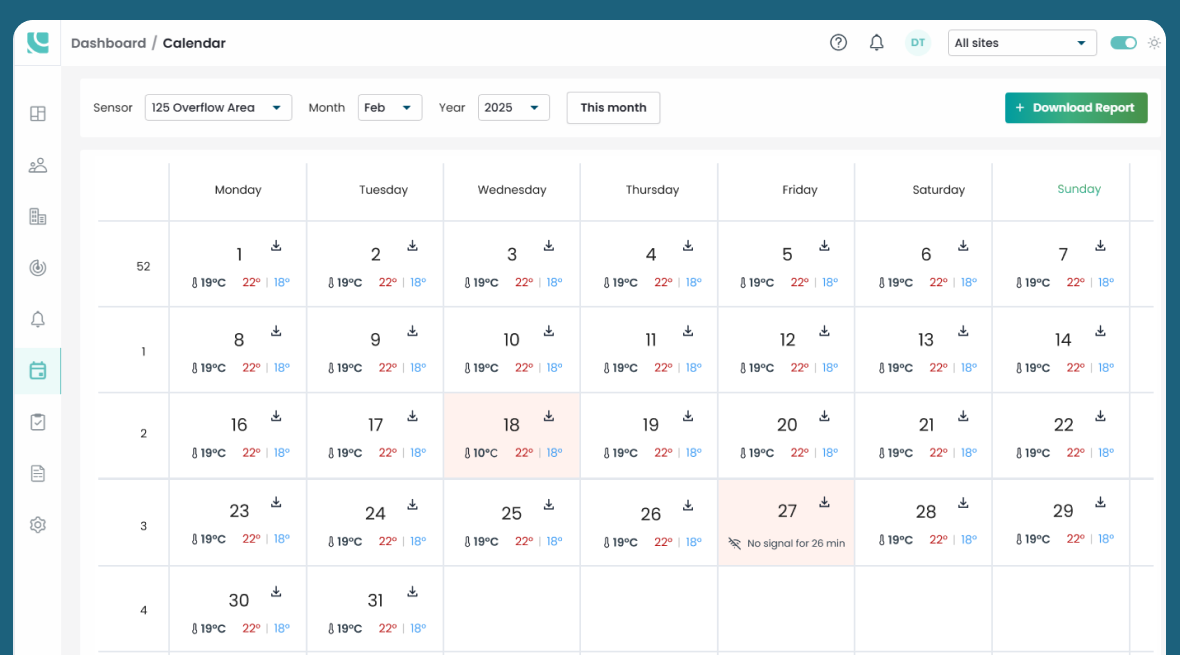
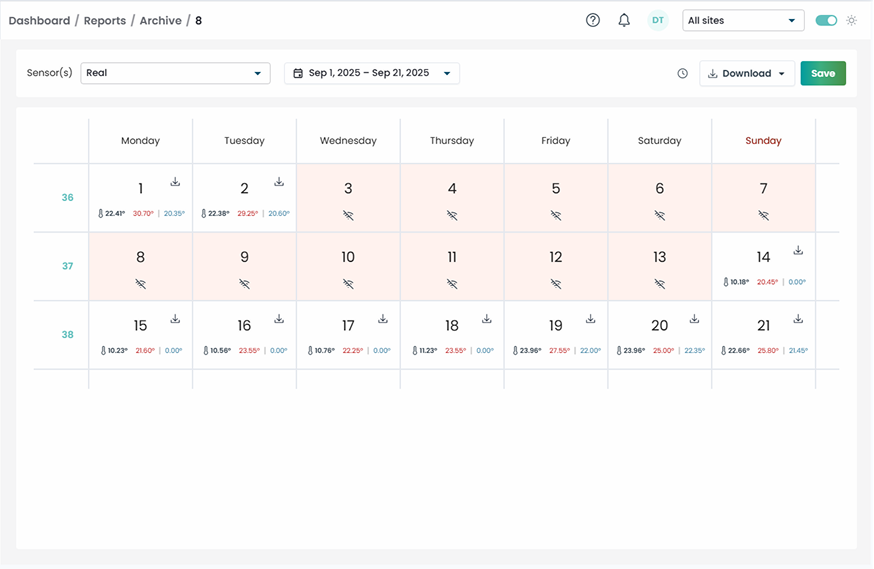
- Calendar and archive views — a monthly grid for each sensor shows daily minimum and maximum temperatures, along with humidity levels, and flags gaps ("No signal for 26 min") so missing data is visible, not silent.
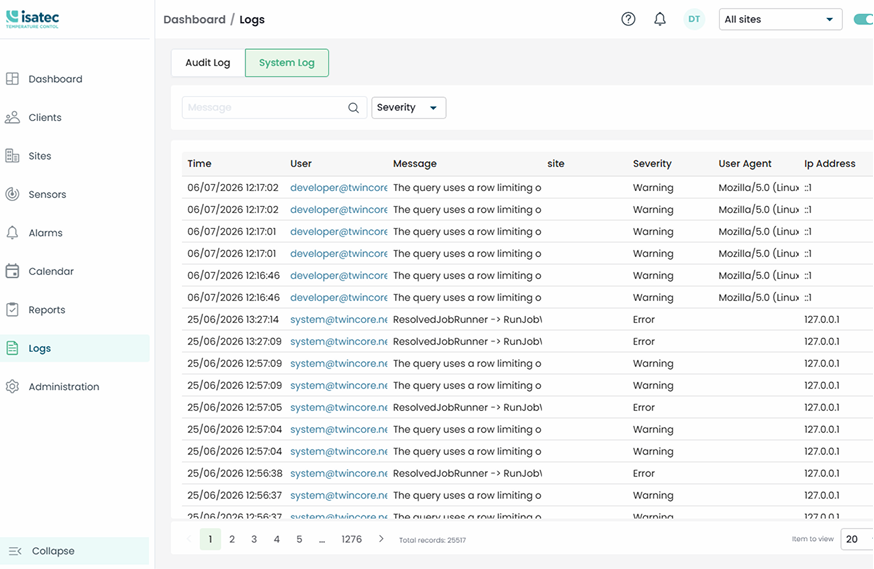
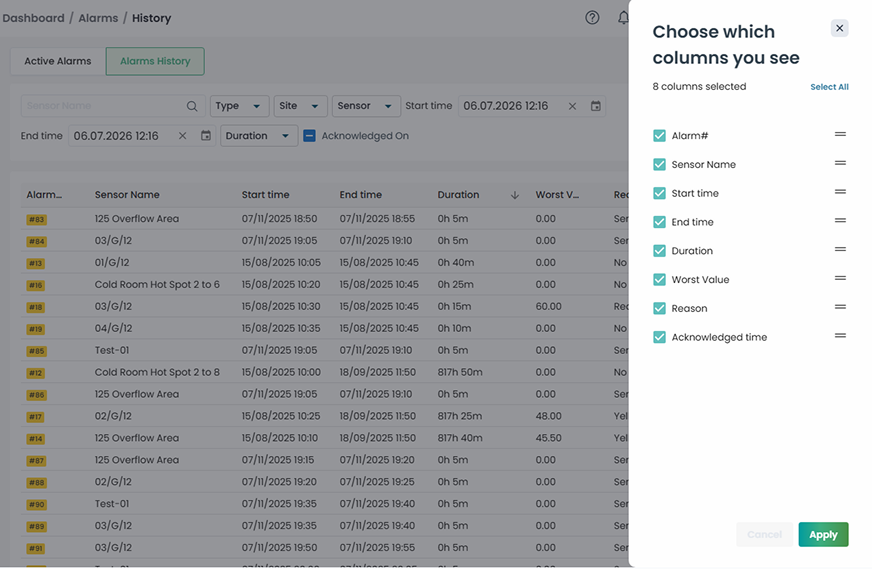
- Audit and system logs — a searchable audit log records each action, including the user, site, severity, IP address, and user agent. The production audit log already contains more than 500,000 entries.
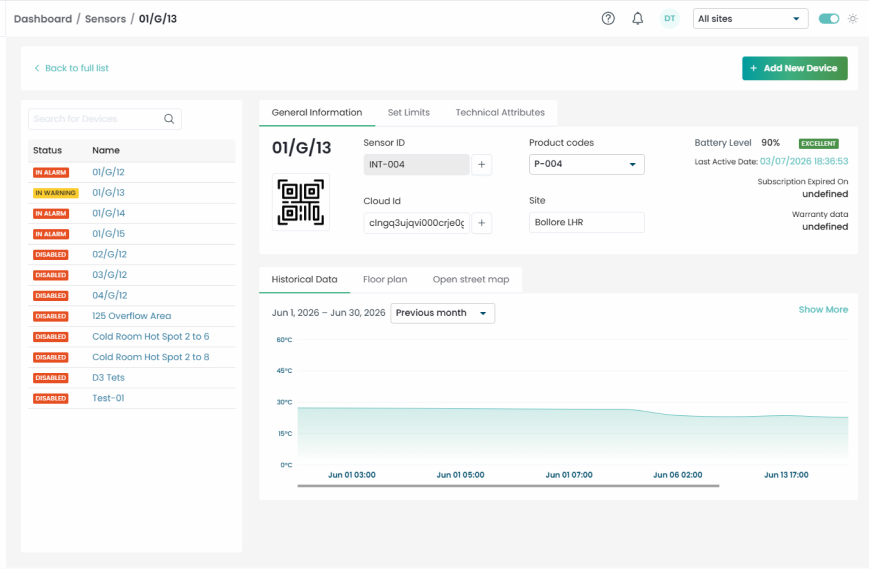
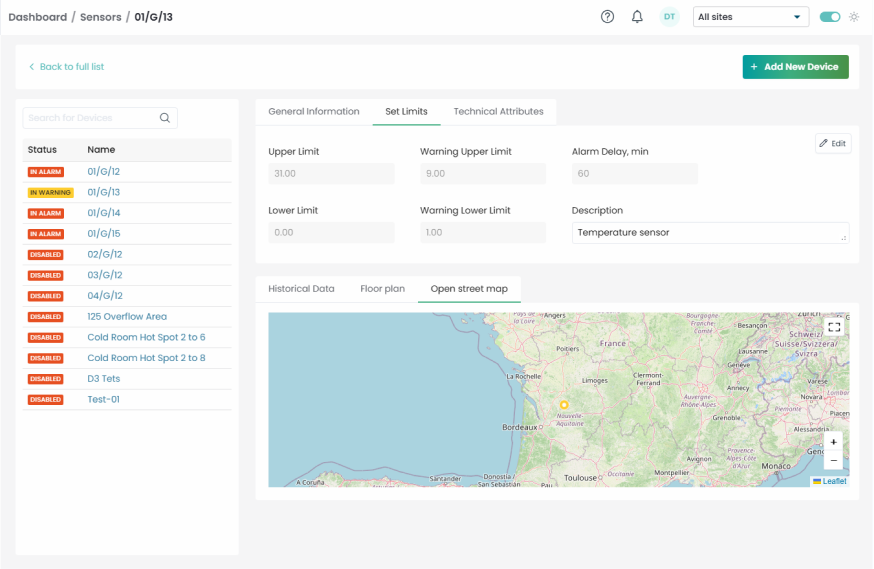
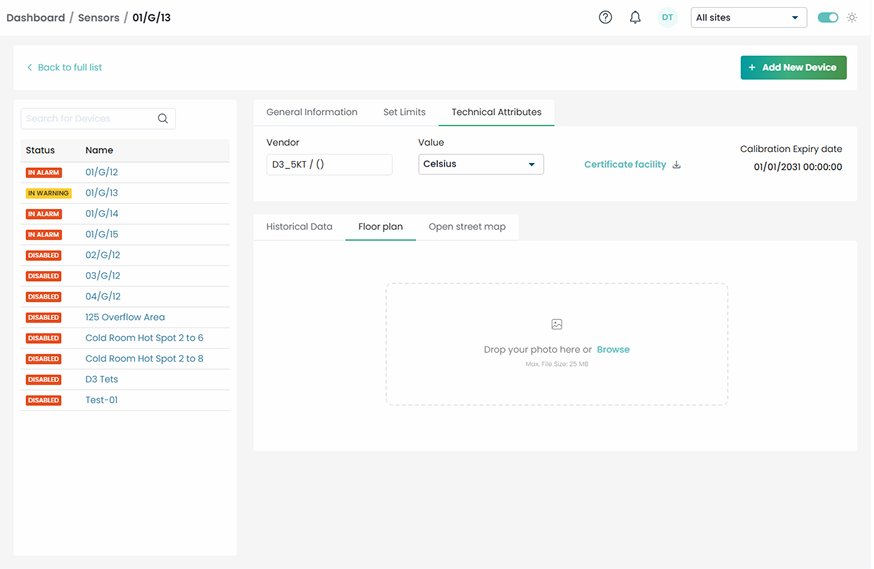
- Device records — each sensor record includes a product code, cloud ID, QR code, battery level, calibration expiry date, and warranty details. Floor-plan photos and OpenStreetMap positions help operators locate devices quickly.
Infrastructure included PostgreSQL for clients, sites, sensors, users, and permissions; MongoDB for high-volume readings; React for the front end; and SignalR for live updates.


Who needs a platform like this
The platform is designed for companies that manage temperature data across multiple customers and sites, rather than for a single warehouse. Typical users include 3PL cold-chain warehouses, pharma and medical distributors, and food operators working under GDP or HACCP requirements. They need to produce complete monitoring records on request. This can be difficult with slow, single-site tools, especially when an inspector requests twelve months of historical data.
One tradeoff we made
TwinCore separated the data based on its structure and usage. Relational data (clients, sites, sensors, users, and permissions) stays in one PostgreSQL database, where relationships and access rules are easiest to enforce. High-volume time-series data (readings recorded continuously over time) is stored in MongoDB. Each client has a separate MongoDB database, allowing each tenant's history to scale independently.
The tradeoff is the need to maintain two data stores and manage synchronization between them. In return, dashboard and reporting queries remain efficient as the number of readings grows into the millions.
Architecture and UI
The data flows from the sensors to the screen as follows: Sensors → Ingestion/Alarm engine → PostgreSQL (entities) + MongoDB (readings) → SignalR → React console
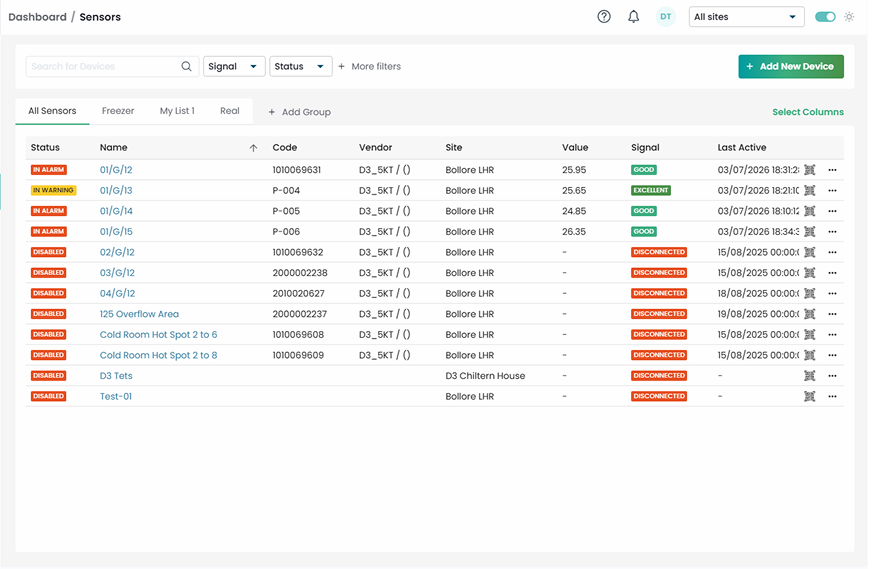
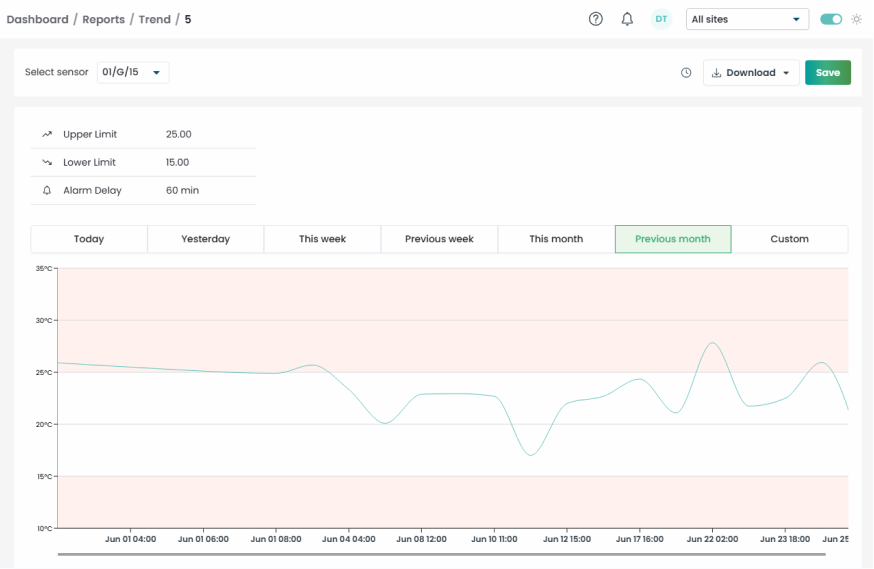
Operators use a filterable sensor list for daily monitoring, with status, signal strength, last activity time, and site information. The trend report lets auditors review temperature history, safe ranges, and out-of-range readings at a glance.
Technologies used
Why TwinCore
The client weighed three options. An off-the-shelf IoT dashboard was the quickest option, but it lacked the multi-tenancy, calibration tracking, and audit-log capabilities required for a compliance service. Keeping the previous system meant living with the same slow screens and manual reporting. Building the platform in-house would have pulled the client's small team away from installing and servicing sensors.
TwinCore was a good fit because the project required experience with legacy .NET systems, IoT data, and real-time applications. TwinCore had previously delivered multi-tenant .NET and React platforms and understood the reporting, audit, calibration, and data-retention requirements of cold-chain monitoring. The team also handled operational edge cases that appeared only after real sensors began sending data.
Ready to scale your ecommerce store?
If you rely on a slow monitoring tool with no real-time view, or if you still prepare GDP/HACCP reports from raw exports, book a 30-minute call. You will receive an initial architecture review, an outline of the main technical risks, and a rough development cost estimate.
