LinkedIn
 Twitter
 Facebook
 Youtube

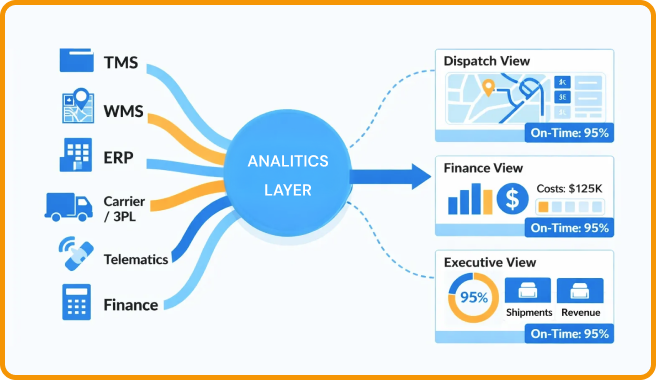
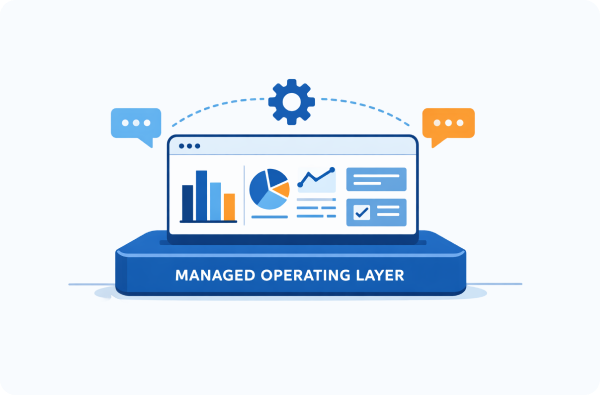
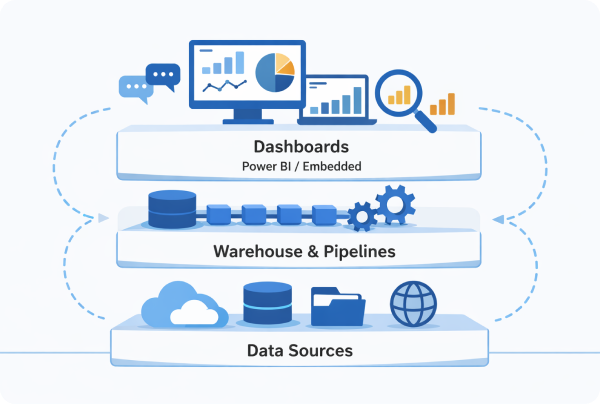
TwinCore builds custom logistics analytics and BI solutions that unify operational, financial, and performance data into a consistent reporting and monitoring layer aligned with your supply chain workflows.
Reporting across TMS exports, finance spreadsheets, carrier portals, and standalone dashboards often produces conflicting metrics and delayed insights. Departments define KPIs differently, reconciliation becomes manual, and generating trusted reports consumes valuable operational time. A structured analytics architecture standardizes definitions, stabilizes data pipelines, and delivers reliable, real-time visibility teams can act on without constant validation.